"A nation that is afraid to let its people judge the truth and falsehood in an open market is a nation that is afraid of its people" once said John F. Kennedy the 35th president of the United States.
As momentum behind the open data movement grows, data journalists, digital artists and developers need to do a truth meter check. How have they used available data so far? Perusing the net for data-driven creations this morning, I land on the Kenyan County Scorecard site. Built by a Kenyan team in collaboration with The Open Institute the site uses data to provide insight into all the 47 counties.
Using data source form the Kenya Open Data Initiative the site utilises open source digital tools such as Open Refine, Google Insight charts, Google Maps and other visualisation tools to analyse [list the issues they address on the site].
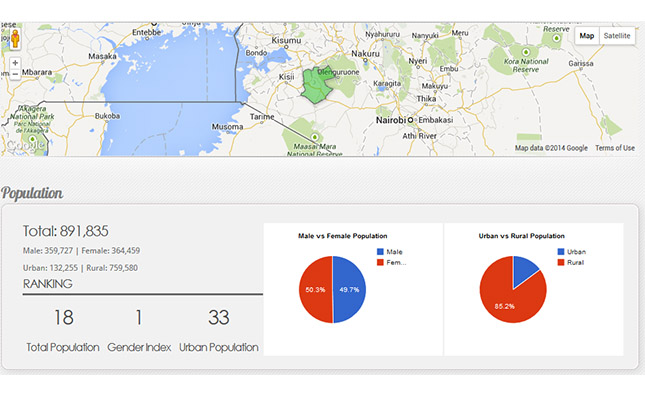
Right now, the main operational feature of the site is a county fact sheet visualisation, which allows the user to select a county. Once selected, a county map, population, and data related to access to social services and health and employment information are displayed in pie charts and tables.
A Constituency Development Fund Review presented on Google maps show the progress, cost and where CDF projects are in operation with how many Kenyans are benefiting, implementation status and project costs, for constituents to keep track of such projects. Filters allow users to narrow in on sectors, for instance water, agriculture, health and others.
The Kenya National Assembly Official records is a repository of parliament proceedings dating from 1911 to 2012. It is posted on the site using Google Books for easy flipping through historical pages.