Take a journey through the timeline using the red bar at the bottom. Click on the articles or clips for more information and to navigate through the years.
Watch a doctor who diagnosed some of the first HIV cases reflect on 30 years of the pandemic.
Watch an activist reflect on 24 years of living with HIV.
Trace the words through time
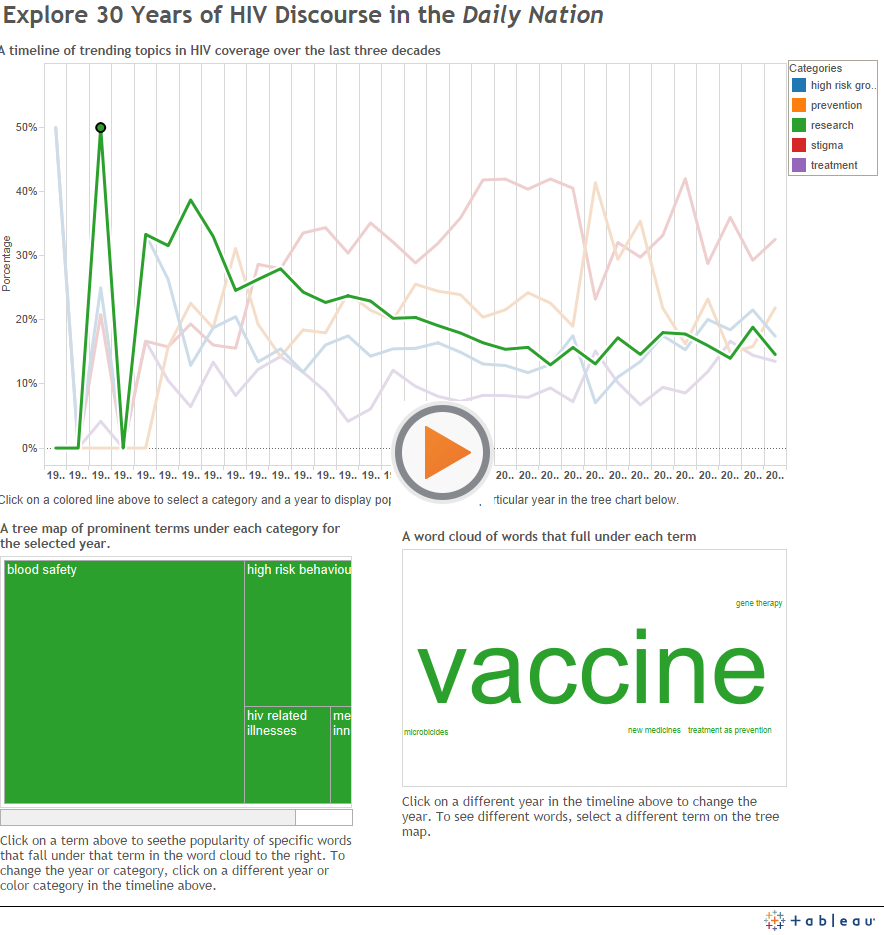
This interactive visualisation of 30 years of coverage of HIV by The Nation Media Group is an opportunity for journalists to explore trends in the media’s treatment of HIV as a political, economic, social and scientific challenge to Kenyans. Through the visualisation, you can answer important questions such as when specific high risk groups were identified, scientific breakthroughs took place and treatment became widely available. Broader themes can also be explored, such as the role of stigma and education in the HIV conversation. The findings from this exploration can be compared to the research trends highlighted on this site to find out if more mentions of high risk groups correspond to a decrease in infection rates for these groups or if scientific discoveries changed investments in HIV treatment. This visualisation is meant to help journalists find answers to questions about how HIV has been covered in the past and what its impact may have been. They also inform how to best cover HIV and other major health issues in the future.
To explore, for example, the evolution of stigma in coverage of HIV, click on the red dot where mentions of stigma spike in 2009. In the tree map below you will see that the largest percentages of mentions fall under the categories of “fear" and “god." If you click on the word “fear” you can see that the most prominent word in the word cloud is “death," followed by “fear," “scourge" and “scary." If you click back on the tree map on “god” you will see that “god” and “church.” You may want to investigate the story angle of the role of the church in combatting or perpetuating stigma at that point in time. To go deeper, click on the timeline on 2009 on “treatment” in purple, which is low, or “prevention” in orange, which dips, to explore why stigma was a hot topic compared to these other important categories where science was evolving. Then explore the years before and after to see if you can identify any patterns.
Observations from The Nation articles
A qualitative analysis of articles published by The Nation in the last three decades reveals that the terms “high risk groups,” “stigma,” “church,” “women” and “cure” appear frequently, but the context in which the words are used and the intensity vary over time.
High risk groups
 In the 1980s, HIV was thought of as a disease that mostly affected gay men; by the mid-1980s, prostitutes, bisexual men, haemophiliacs and people who inject drugs were also seen as high risk groups. As the decade came to an end it was clear that HIV was also a disease of heterosexuals.
In the 1990s and 2000s media stories reflected the reality that HIV in Africa had acquired a feminine face with high prevalence among women of reproductive age. During this time, scientists focused on the phenomenon of discordant couples (long-term sexual partners in which one has a sexually transmitted infection and the other does not). Now the HIV epidemic in Kenya is mixed with characteristics of both a generalised epidemic among the mainstream population, and a concentrated epidemic among specific most-at-risk populations and geographies.
Stigma and discrimination
In the first decade of HIV reporting there was a lot of misinformation, fear, stigma and discrimination surrounding Aids globally. In the media terms such as “mysterious,” “fatal,” “baffling” and “crippling” intensified the fear associated with the condition.
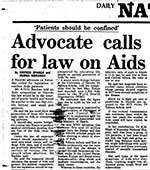
As HIV took its toll in the 1990s fear mounted in various sectors of society and calls to quarantine HIV positive people grew. Attitudes also shifted ‒ from rejection and stigma to overt discrimination. In reaction, organisations, activists and celebrities started to campaign for the rights of HIV positive people and to highlight the harmful effects of stigma and discrimination. They lobbied for the creation of laws on Aids and employment policies.
As more people got HIV, a section of the Church broke its silence about the virus and more HIV positive people announced their status publicly but others, including government leaders, were in denial about HIV and Aids. Discrimination and stigma including self-stigma persisted.
In the 2010s articles in The Nation focused on the increased action on the policy front and on how stigma and discrimination hinders access to prevention, treatment and care services. There were also stories reinforcing that HIV is no longer a death sentence.
Cure
In the articles on HIV that The Nation published in the 1980s the term “cure” was used in the context of explaining that the condition had no cure or vaccine and was fatal. There were also reports of people seeking treatment from herbalists and scientists who claimed to have found the cure.
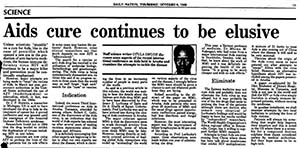
Towards the end of the 1990s stories also focused on why an HIV cure or vaccine remained elusive. But the story turned more hopeful in the late 1990s with increased access to antiretroviral drugs. By the 2000s a lot of attention was being given to the side-effects of anti-retroviral drugs. The stories also focused on the latest scientific developments in relation to treatment and the role of HIV testing in preventing the spread of the virus.
Scientifics breakthroughs in the 2010s, near universal access to prevention of mother to child transmission of HIV and improved access to more effective antiretroviral drugs made governments, scientists and activists begin to talk about an HIV-free generation but still the pilgrimage to ‘quack’ doctors and herbalists continued.
Church
The newspaper articles reveal that the church was largely absent from the HIV debate in the 1980s until towards the end of the decade, when the institution started to argue that HIV is a sign of immorality and openly shunned HIV positive people.
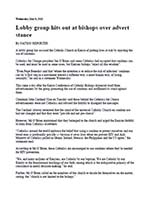
The Church maintained the same stance on HIV and Aids in the 1990s. Church leaders declared that they would not marry couples who had not gone for HIV tests and they came out strongly in their opposition to sex education and condom use. But as HIV continued to take a toll, by the end of the decade, many churches joined the HIV campaign. However, over the years the Catholic Church has maintained its vocal opposition to condom use.
Women
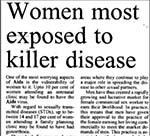
By the end of the 1980s it became apparent that women are at a higher risk of HIV in Kenya and Africa than men because of biological and socioeconomic reasons. Due to its nature the cervix is a site of particular susceptibility. Economic dependency and domestic violence in many women's relationships make it difficult to "negotiate" condom use with their sexual partners.
In the 1990s many stories focused on reducing transmission of HIV from mother to child.
Watch a journalist recount his experiences covering the early years of HIV.
Watch the Director of the National Aids Control Council reflect on the next 30 years of HIV in Kenya.
- This section contains a collection of photo essays by local journalists about Living with HIV
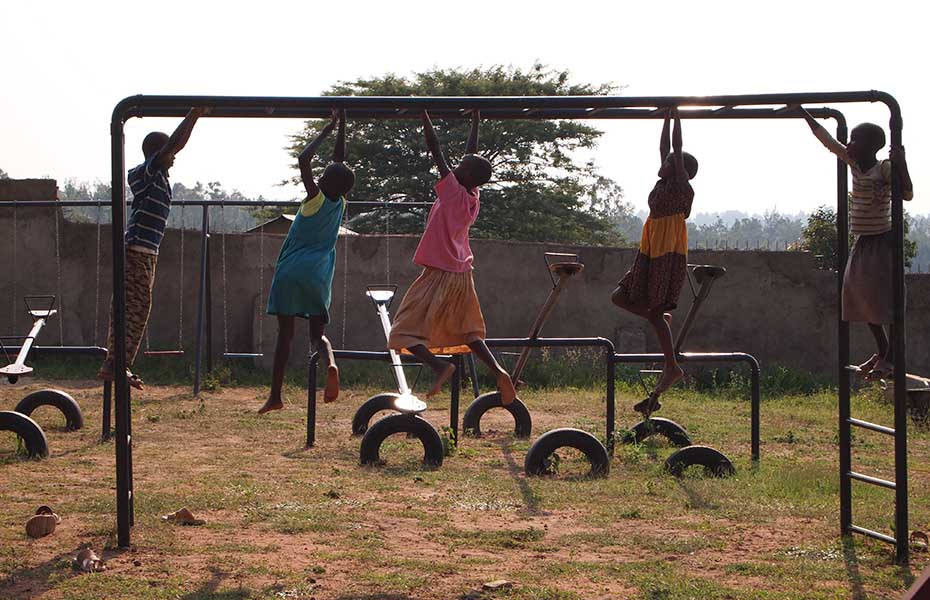
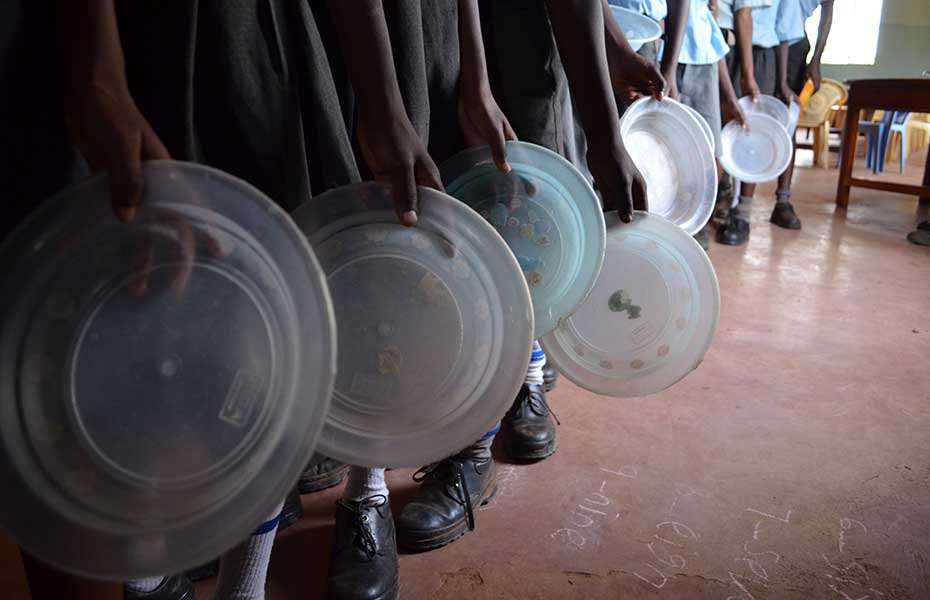
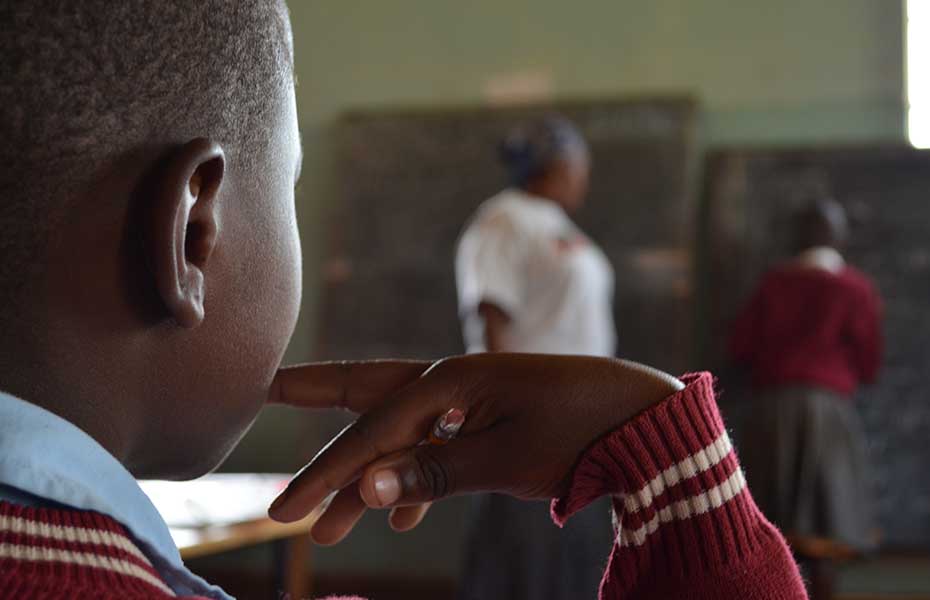
- Refuge for AIDS orphans
-
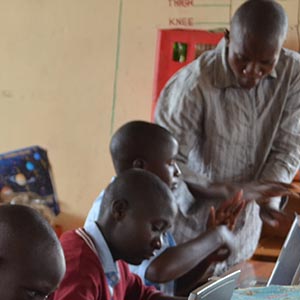
Sam’s place for deaf orphans in Rongo, on the outskirts of Kisii town, is home to 40 orphans. Sixteen of them have been orphaned by Aids.
In 2010 the home took in seven children thanks to a donation of 8 million Kenyan Shillings (USD 90 000) by Mr Sam McRenolds of South 11th & Willis Church of Christ in Texas in the US.
The orphanage has six teachers. Two of them offer carpentry and sewing training while the rest teach academic subjects.
Photos by: Joseph Othoth, KNA-Kisumu
-
-
-
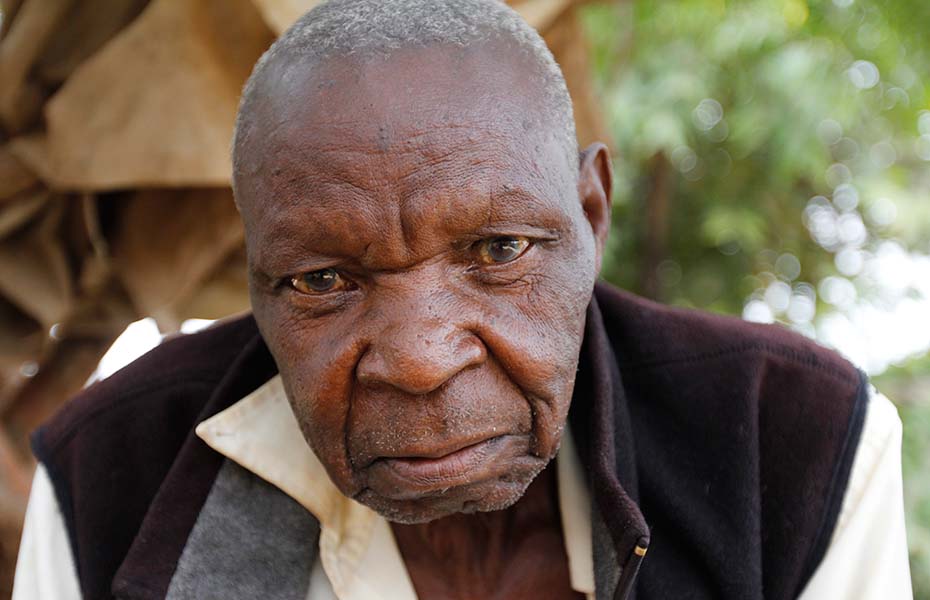
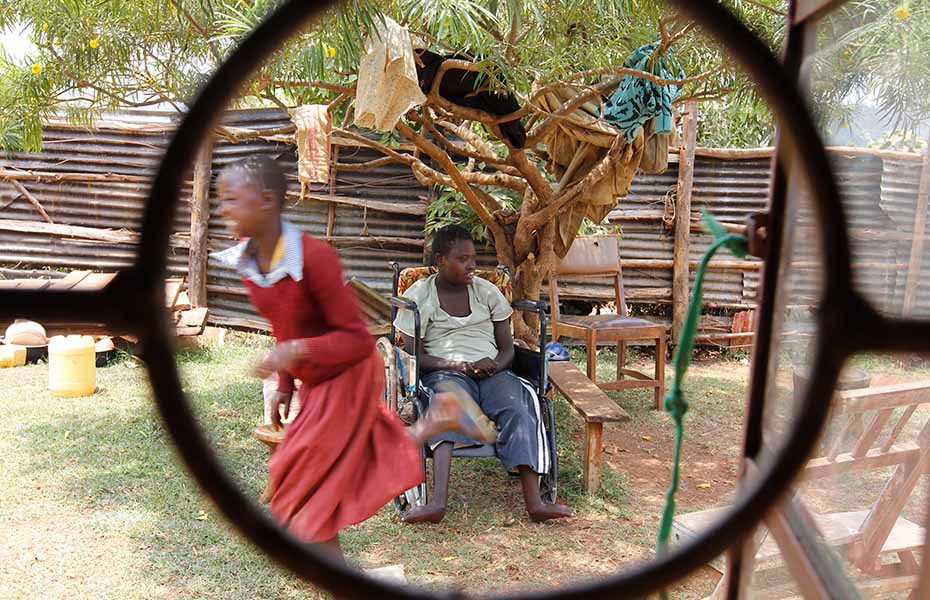
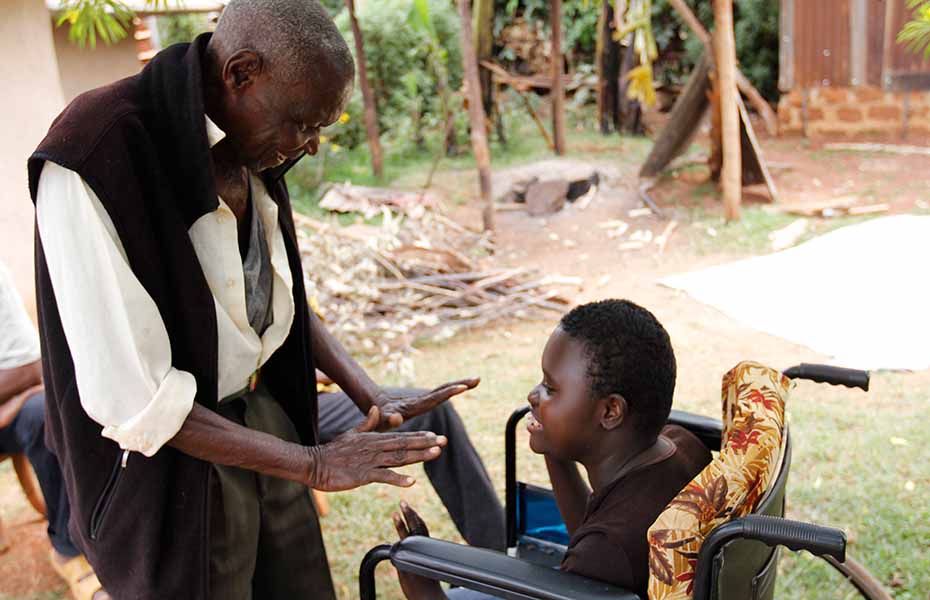
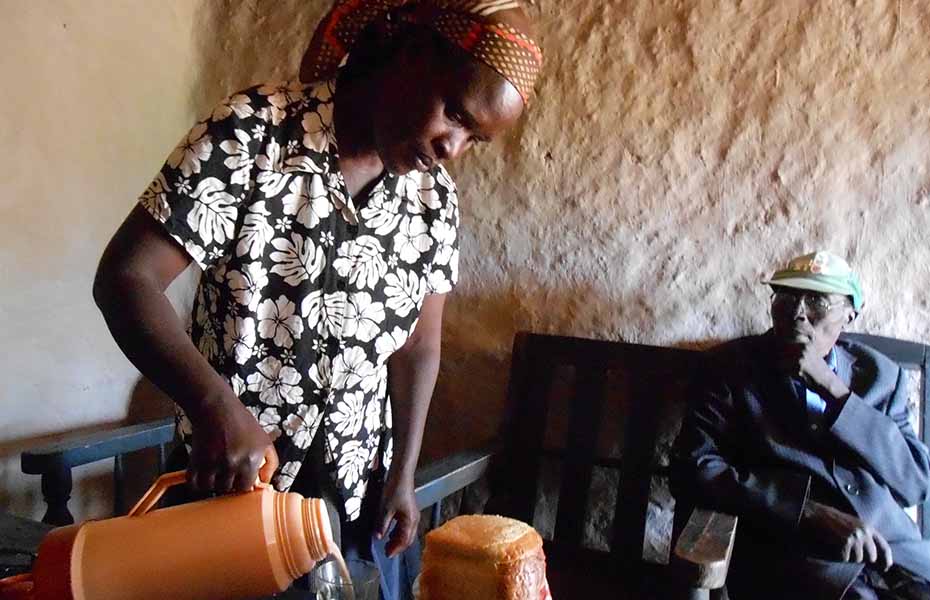
- AIDS toll on the family
-
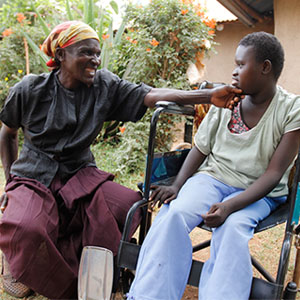
Edna Mogiti, 25, needs to use a wheel chair due to physical and developmental disabilities caused by contracting the polio virus at the age of one.
Edna’s parents died of HIV complications when she was only five leaving her under the care of her grandparents. Edna’s 82-year-old grandfather David Ombasa had lost all of his four children, two of them from complications of HIV.
The situation got worse when his wife, who helped to care for Edna, died eight years ago. Apart from Edna and a 15-year-old grandson who is still in school, David’s other grand children left home in search of work.
Aging and sickly, David and Edna rely on neighbours neighbours and well-wishers to take care of them. They include 38-year-old mama Rose Kinyanya who volunteers to bathe Edna every morning and cooks for the family daily.
Photos by: Monicah Njeri Mwangi, The Star
-
-
-
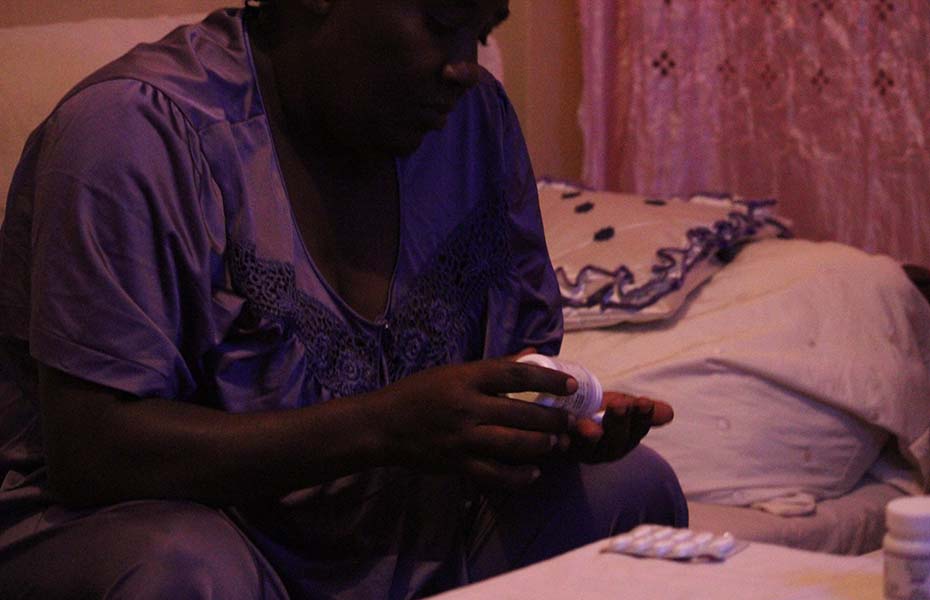
- Living positively
-
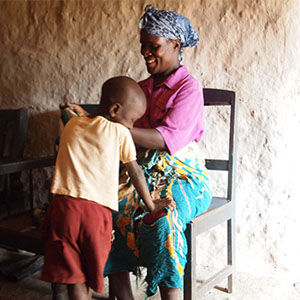
Mary takes pride in taking care of her family of eight including a grandson. She and her husband, Thomas Moire, were diagnosed with HIV in 2009.
At first, Moire did not accept his HIV status, but Mary is encouraging him to face his fears.
Moire suffers from self-stigma – he hasn’t forgiven himself. And then he feels he faces stigma from those who know his status.
When she is not picking tea in their farm, she looks for informal work in other farms to earn money to buy food for her family. Sometimes she travels as far as six km to work for a whole day for Sh100 (a little over one US dollar)
Photos by: Agatha Ngotho, the Star
-
-
-
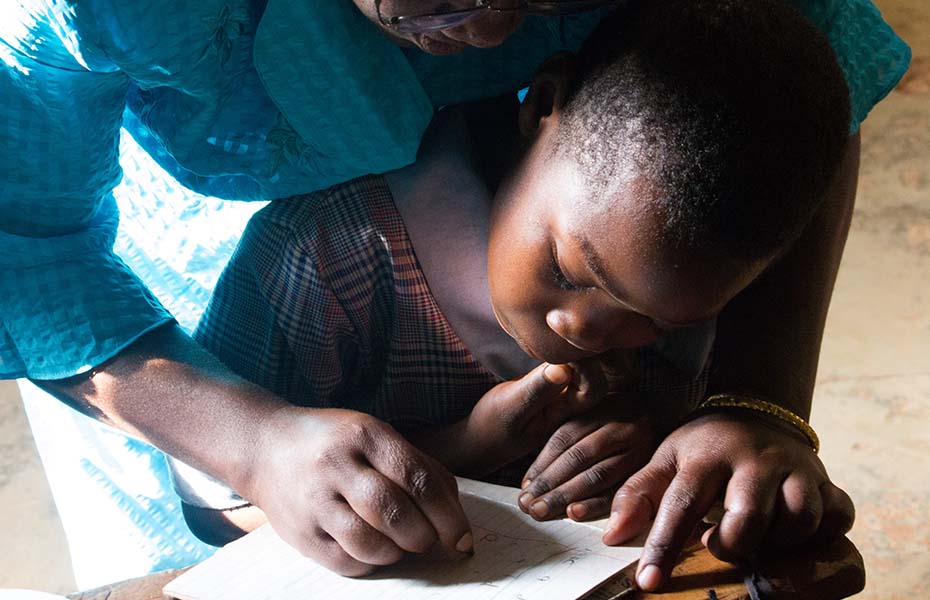
- Keeping hope alive
-
Rose Nyala is a 44-year-old mother of two who has been living with HIV for the last 11 years. A teacher at Bomondo Church of God Primary School in Nyamira, she has never regretted going public about her status.
Rose, who is on antiretroviral drugs, is in good health. Once every week, Rose holds a counselling session with Standard Seven and Eight pupils (ages 13 – 15) during their lunch break. She has devoted her life to highlighting the challenges facing Aids orphans.
Rose separated from her husband years ago. Her son works in Nairobi while her daughter is a first year student at Kenyatta University.
Photos by: Mercy Juma, NTV Kenya/The Daily Nation
-
-
-
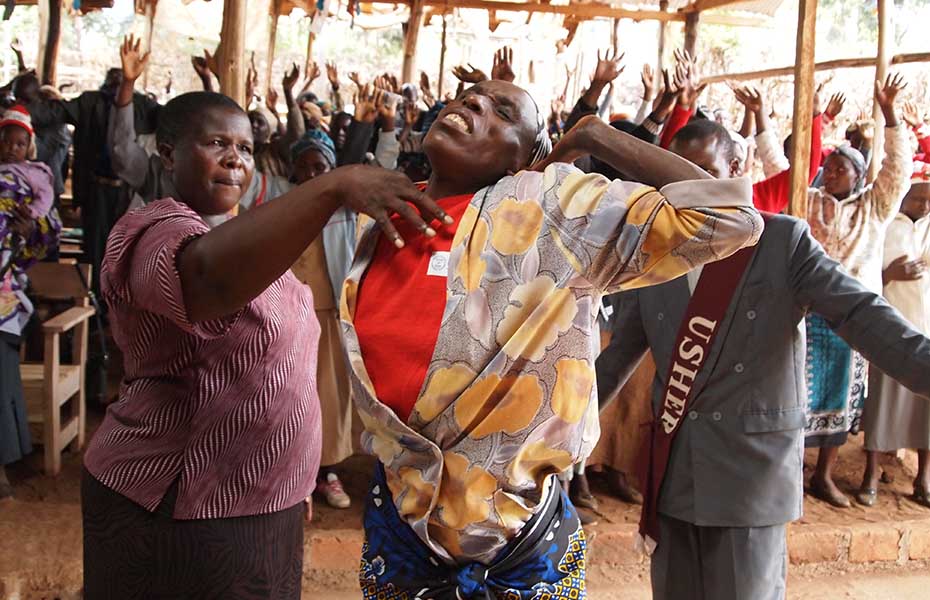
- Another Loliondo*
-
Pastor Kennedy Chongamu at the Immanuel Church in Nsicha claims to be a miracle healer. On Wednesdays, Saturdays and Sundays hundreds of people come from far and wide seeking to be healed by the pastor of cancer, HIV and other diseases.
But not everyone trusts the pastor. They say his church is another "Loliondo." Pastor Chongamu is quick to say that he worships the true God. “This is not ’Loliondo,’ though we have healed people of many illnesses, we do not ask them to stop their medication,” he says.
A father of seven, he lives with over 30 “spiritual children,” who are orphans that he provides an education for.
*Loliondo, a town in Tanzania, was in the news because of claims of a miracle Aids cure.
Photos by: Kiundi Waweru, The Standard
-
-
-
Explore how the prevalence of HIV and the uptake of HIV testing changed between 2007 and 2012 by clicking on the tabs below.
2014 marks 30 years since the first documented case of HIV in Kenya. This occasion inspired Internews in Kenya to create 30 Years of HIV, an interactive digital project that explores the media coverage of the HIV epidemic in Kenya over time and marks key milestones along the way.
The project is intended to help journalists and society reflect on its own evolving understanding of the political, social, economic and human impact of HIV and whether the information provided over three decades has done justice to the complexity of one of the greatest challenges of our time.
The project does this through a 3D timeline, interactive visualisations of 30 years of coverage of HIV by The Nation newspaper, photographic essays of people living with HIV and multimedia pieces that share the experiences of experts who are and have been on the frontline of the epidemic.
A review of data reveals that the country’s HIV epidemic is not as generalized as previously thought. Hyper-epidemics persist in parts of the country and this means that to succeed the HIV response must give special attention to populations at higher risk of HIV.
Copyright: You may download and republish the infographics, data and other resources. Please credit Internews.
You can also embed the project on your website using the code below:
<iframe frameborder="0" style="border-width:0;" width="900" height="600" src="../dataportal/30_years_of_HIV.html"/></iframe>
Nation coverage on HIV analysis visualisation
Internews in Kenya's retrospective on HIV in the Kenyan media considered equally the news content as well as the language associated with that coverage. Our approach to this project studied the general tag trends as seen in the Words Through Time section.
The Nation newspaper articles were sourced from the media house’s archives by querying articles tagged HIV and AIDS and from the Internews in Kenya library. The process took several weeks and resulted in 9,419 articles.
Using Microsoft OneNote, the PDF articles were converted into word or text documents to enable analysis in Overview Project. About 30 percent of the articles were not analysed because they were illegible following conversion into text.
Tableau Public Visualisation: Words through time
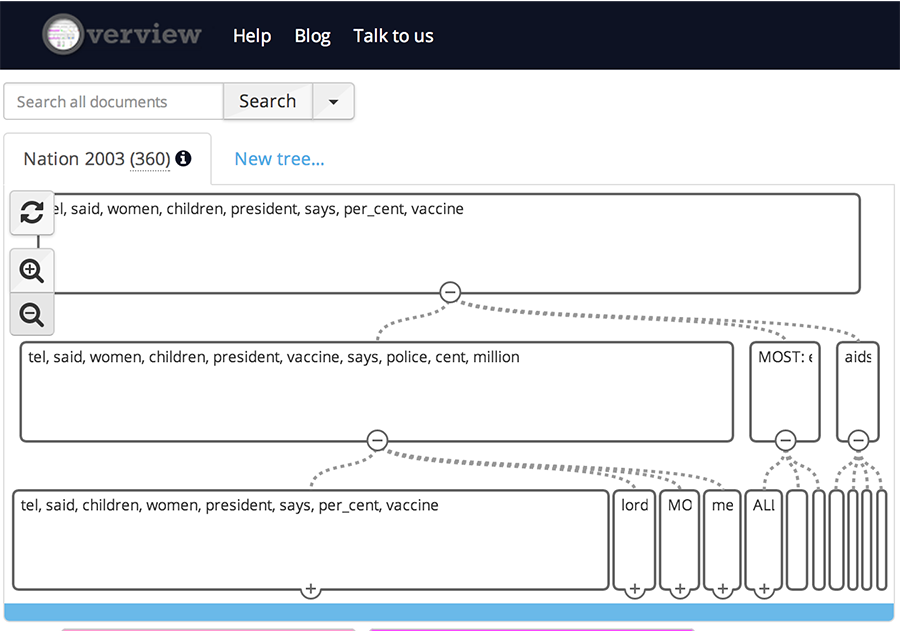
In order to derive meaning from the text of each of The Nation articles, we began the Overview Project, an online open-source tool originally designed to help journalists find stories in large numbers of documents. Overview Project goes through all the words in a document and identifies trends: words that appear often, words that appear frequently with other words, topics and subtopics. Overview enabled us to analyse the text of all the articles by year and begin to identify trends, both topics and then specific words under these topics, and track these changes over time. It displays findings in a tree structure like this with the size of the box corresponding to the number of articles that contain those words:
Once we ran all the articles for all the years through Overview Project, we had a good idea of the important words and topics in each year. There were some surprises, such as the frequency of women and education, which we had not expected. From this initial analysis we made our own list of words to search for. These fell into three categories.
1. Words: This included all words or groups of words (such as “commercial sex workers”) that we wanted to count in each year. 2. Terms: This allowed us to group words that are basically synonyms. For example, we grouped “commercial sex workers,” “prostitutes” and “female sex workers” into the same term since they are different words to describe the same thing. 3. Categories: This is where subjective analysis came into play as we started to make sense of the terms as they fell into certain topics. For example we included the terms: men who have sex with men, people who inject drugs, sex workers, truck drivers and women into the category high risk groups.
Once we had a list of words, terms and categories, we added a layer of 92 tags in Overview Project. This means, we typed in the specific word and Overview Project counted the number of mentions in the year and tagged it with a different colour. The result of tagging appears like this:
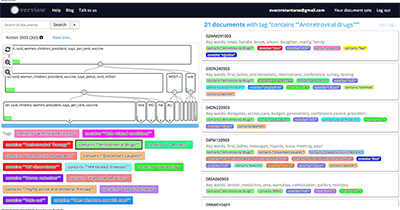
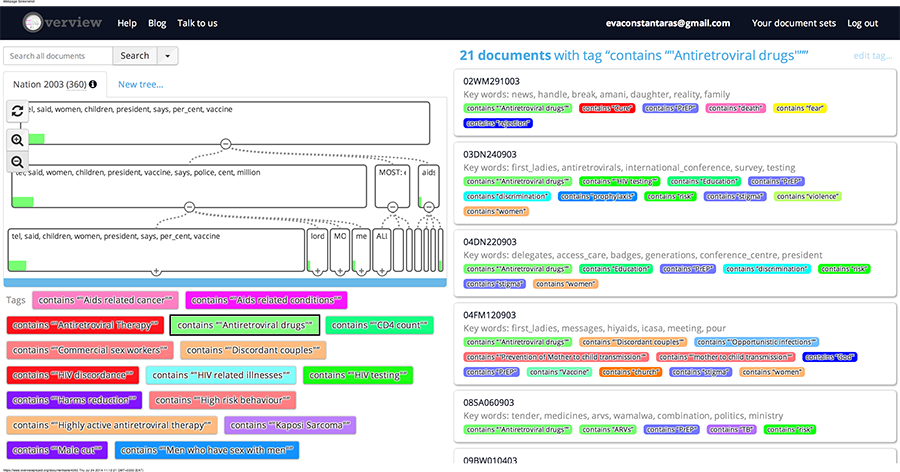
On the right hand side you can see a display of how many times each word tag appears in each article. If you click on one of the articles it will show you where it appears in the text. This makes it easier to quickly review the context the word was used in:
Once we searched for all the tags in all the years, we exported this list by year. This gave us a total count of how many times each of the 92 words were mentioned each year.
Next, we opened these counts in Excel and added a few new columns. We added a column to classify each word by term and each term by category. We also added a column for the year.
In order to show the relative importance of each word, term and category, we did a few calculations:
1. We calculated the percentage of each word under each term. For example, if prostitute was mentioned two times out of a total four words tagged under sex worker, the frequency of prostitute under sex worker would be 50 percent. 2. We calculated the percentage of each term under each category. For example, if the term sex worker was mentioned four times in high risk groups, which had 16 total mentions for that year, then 25 per cent of content under high risk groups related to sex workers. 3. Finally, to give a broad overview, we calculated how many words were mentioned under five broad categories: High-risk groups, Prevention, Research, Stigma and Treatment. To do this, we took the total number of mentions of each word under each category and divided it by the total number of words. For example, if there were 50 words categorised under high-risk groups and a total of 500 words, then 10 percent of the content fell under the category high-risk groups.
Our next step was to visualise our findings using Tableau Public. We broke down the visualisation into three parts.
1.The timeline gives a broad overview of how the discussion around HIV has evolved by tracking the popularity of categories over time. Therefore, the timeline displays the percentage popularity of each category by year. 2. The treemap displays more specific data: it shows the term frequency under the category you selected on the timeline. The bigger the square, the more frequently that term appeared under that category. Note, the treemap does not allow you to compare terms in different categories. You can only display the terms under one category at a time. 3. The most granular data is the word cloud. The word cloud shows the frequency of each word grouped under each term. The size of the word corresponds to the frequency of the word under the term.
A time slider allows you to visualise how term and word frequency change over time. The colours display the relationships between the categories, terms and words from each part of the visualisation.
Access the data behind the visualisation …
Data analysis
The project scraped (transferred data from human-readable input to digital) HIV-related data from PDF reports and publications, journals, government ministries, dump files and online data portals. The data was analysed using Stata and Excel and displayed graphically using google fusion maps. Infographics were created using Adobe illustrator and isotype interactive charts were created using d3 and polymer.
1981
1983
1985
1986
1987
1988
1989
1990
1991
1992
1993
1994
1995
1996
1997
1998
1999
2000
2001
2002
2003
2004
2005
2006
2007
2008
2009
2010
2011
2012
2013
Data
- KIAS 2012 Knowledge and disclosure of HIV
- KAIS 2012 TB STI cervical cancer
- KAIS 2012 Sexual risk behaviour and condom use
- KAIS 2012 response rate data
- KAIS 2012 reproductive health and PMTCT
- KAIS 2012 male circumcision
- KAIS 2012 Knowledge attitudes & beliefts
- KAIS 2012 Incidence between 2007 versus 2012
- KAIS 2012 Household characteristics data
- KAIS 2012 HIV prevalence data
- KAIS 2012 HIV incidence
- KAIS 2012 Couples and cohabiting partners
- KAIS 2012 children & youth
- KAIS 2012 Care and treatment
- KAIS 2012 Blood and injection safety
- KAIS 2012 HIV testing
- Prevention of mother to child transmission of HIV
- The picture of HIV in Kenya
- UNAIDS 2013 Datasets
- HIV risk behaviours
- MARPs Polling BOOTH survey 2009 data
Infographics
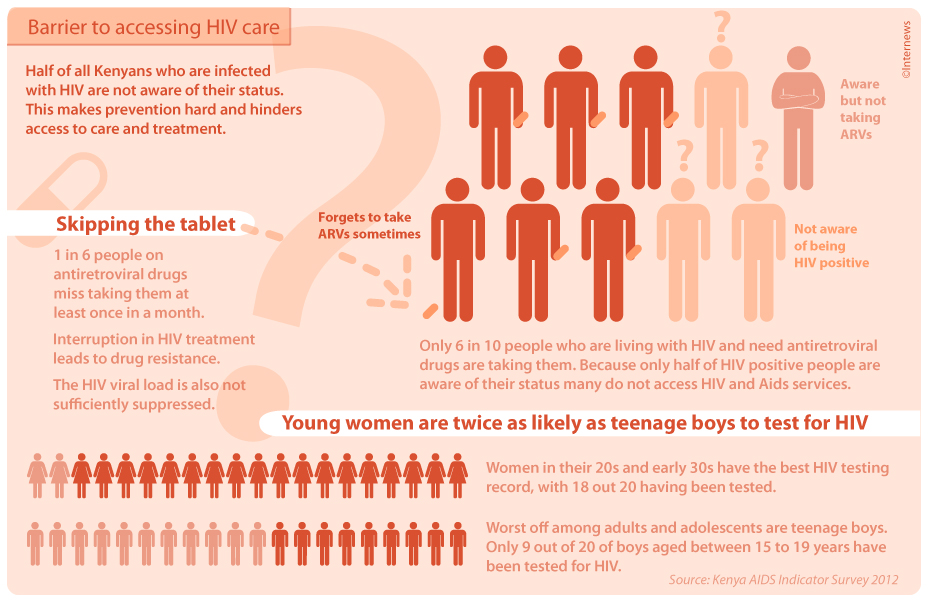
- Barrier to accessing HIV care
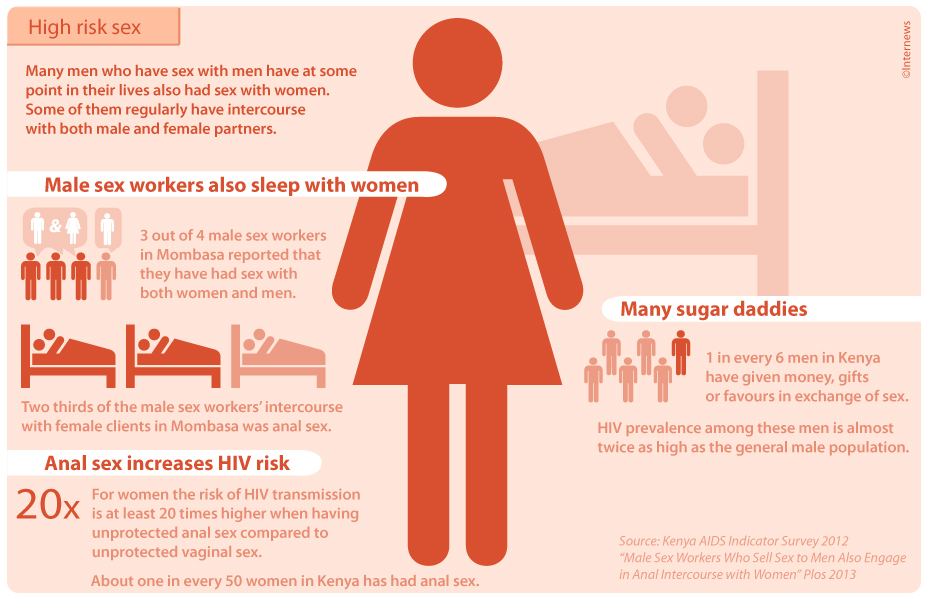
- High risk sex
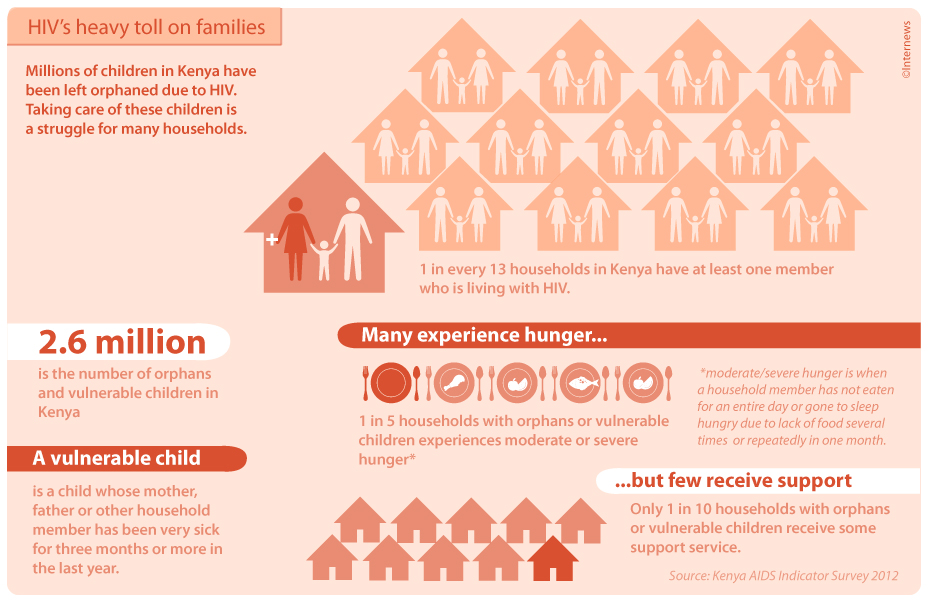
- HIV's heavy toll on families
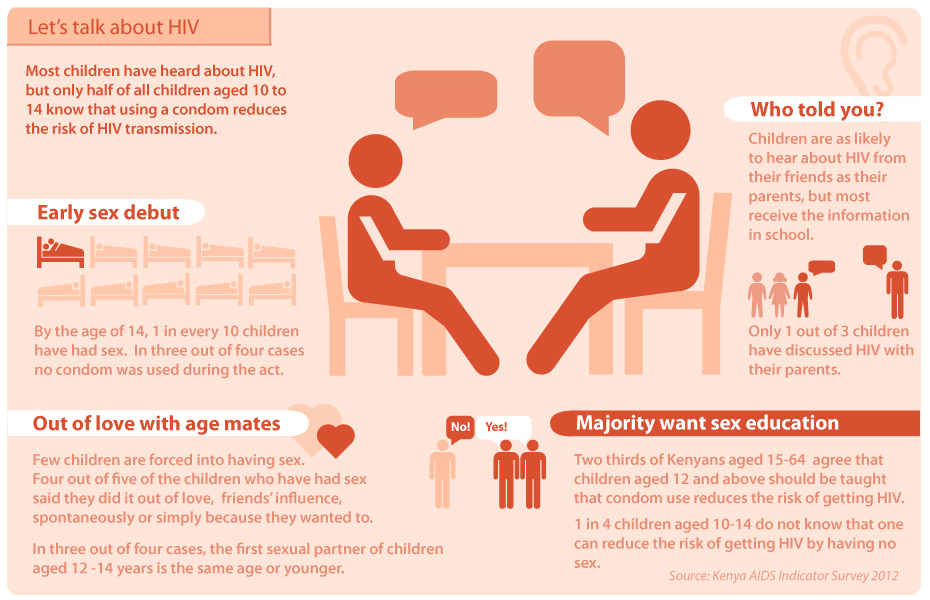
- Lets talk about HIV
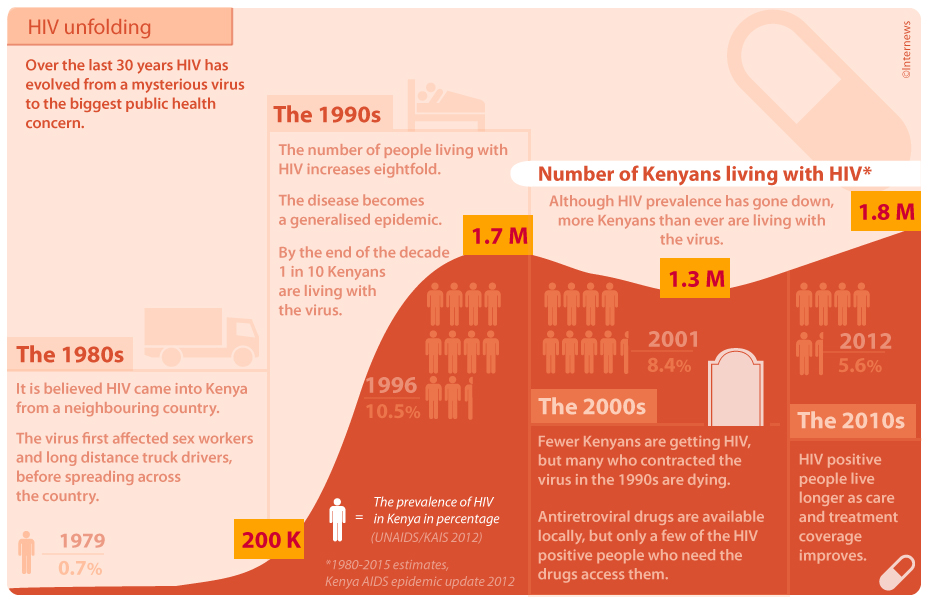
- HIV unfolding
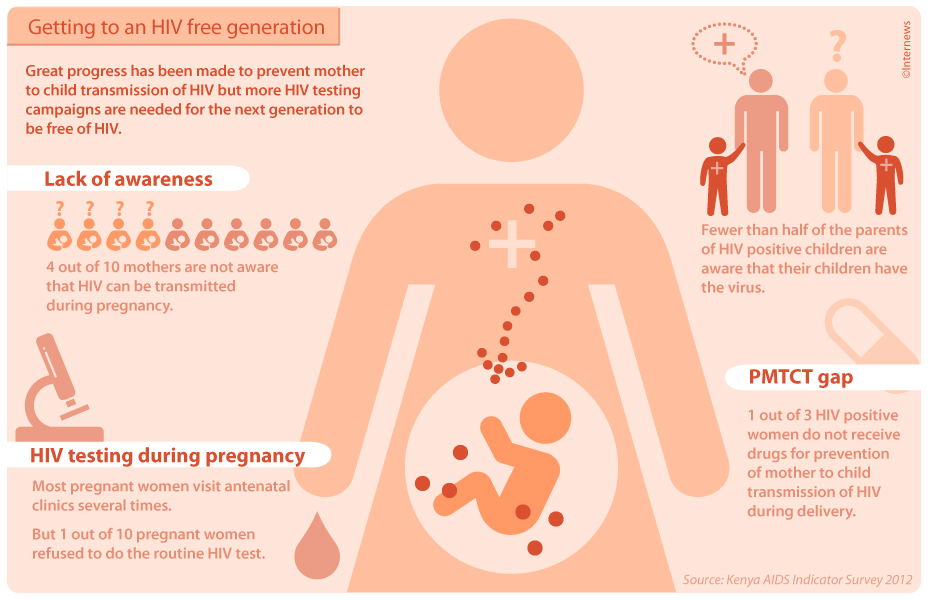
- Getting to an HIV free generation
Media stories inspired by project
- 30 years of HIV- Daily Nation online
- #HIV30KENYA- Nation twitter conversation
- Month-long Fete Aimed At Marking 30 Years Of HIV and AIDS Fight In Kenya-K24
- Victims Cite stigma As The Greatest Challenge In Kenya, As World AIDS Day Is Marked-K24
- Photo exhibition documents 30 years of HIV – The Standard on Saturday
- 30 years of HIV in Kenya –Daily Nation, DN2
- KBC, World Aids Day interview with Internews Country Director
- KBC's World Aids Day interview with a doctor an a lay living with HIV
- Over 50,000 men having sexual relations with men in Kenya
Reference material
- Kenya HIV estimates 2014
- HIV and AIDS in Kenya
- AIDs county profiles
- Associations between Intimate Partner Violence and Health among Men Who Have Sex with Men: A Systematic Review and Meta-Analysis
- Baseline Polling Booth Surveys among Male and Female Sex Workers in Nairobi and Mombasa NASCOP Learning Sites Ministry of Health National Aids and STI Control Program NASCOP
- Geographic mapping of most at risk populations in Kenya June 2012
- HIV Prevention Response and Modes of Transmission Analysis, March 2009.
- Housing and population census, Kenya - 2009
- Internews in Kenya media resource centre
- Kenya Aids Indicator Survey 2012
- UNAIDS Global Report 2013
- Kenya Aids epidemic update 2012
- Kenya Aids Indicator Survey supplement
- Kenya Aids Indicator Survey2007
- Kenya County factsheets June 2013
- Kenya Demographic and Health Survey 2008-09
- Kenya Economic Report 2013 by Kenya Institute of Public Policy Research and Analysis
- Kenya Health Information System Integrated Disease Surveillance Reports
- Kenya National Aids Strategic Plan 2009/10 ‒ 2012/13
- Kenya National Health Accounts
- Kenya National Bureau of Statistics, 2009 Census
- Male Sex Workers Who Sell Sex to Men Also Engage in Anal Intercourse with Women: Evidence from Mombasa, Kenya
- Monitoring the situation of women and children: Multiple indicator cluster survey, Kenya National Bureau of Statistics, 2011
- Nation Media Group library
- Official Development Assistance (ODA) for Health to Kenya by the World Health Organization
- Online archives of various Kenyan and International media houses
- Populations at Increased Risk for HIV Infection in Kenya: Results From a National Population-Based Household Survey, 2012
- 2010-2011 Integrated Biological and Behavioural Survey among Key Populations in Nairobi and Kisumu, Kenya
30 Years of HIV is an interactive digital initiative that explores media coverage of the HIV epidemic in Kenya over time and visualises key milestones along the way. The project is intended to help journalists and society reflect on the evolving understanding of the political, social, economic and human impact of HIV and whether the information provided over three decades has done justice to the complexity of one of the greatest challenges of our time. Click here for an overview of the project and click on the tabs to navigate through it.