What is the visualization about?
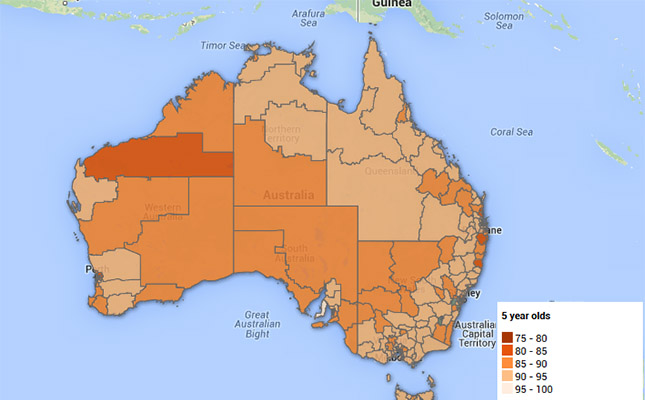
This interactive map shows improvement in the under-five death rate from 1990 to 2007. With simple interactive maps, a slope graph and textboxes, the map shows each country’s position ranked among 189 countries.
Using the United Nations Children’s Fund (UNICEF) data the author Chris Stolte, Tableau's Chief Development Officer, seeks to show improvement in neonatal deaths worldwide.
What is effective and ineffective about the visualization?
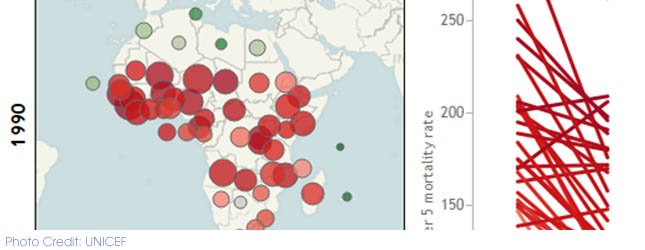
Crowding data on neonatal death rate and how each country ranks into one map would make it hard for the reader to make comparisons. The juxtaposition of two interactive maps allows historical comparison though it can be difficult to tell how much the size of the bubble has changed from one map to the other. However, the bubble charts allow a general comparison of rates between countries. To view a particular country, a check list of six continents is available. Upon clicking a continent, interactive bubble charts overlaid on a map and a slope graph with all African countries appears. To highlight how each county ranks and its mortality rate, red and green circles represent 1990 and 2007 respectively.
How does the data visualization strengthen the story?
The continent checklist enables the reader to dig more deeply into the region he or she is interested in. In addition a colour scale for the country rank distinguishes countries with a high child death rate from those with relatively low death rate.
The red and green bubbles are also easier to compare when only a few countries are selected. The reader can include or exclude the countries(s) to be displayed in the slope graph, which illustrates how sharply rates have fallen.
How can this visualization be adapted to the Kenyan context?
With historical data on child deaths, the data is well-suited for a line graph that shows change over the years. Additional factors can be added including the probability of a child dying in the first month after birth and rates of diseases most likely to contribute to under-five deaths.
To learn more about tools for effective data visualization please contact us: [email protected]